

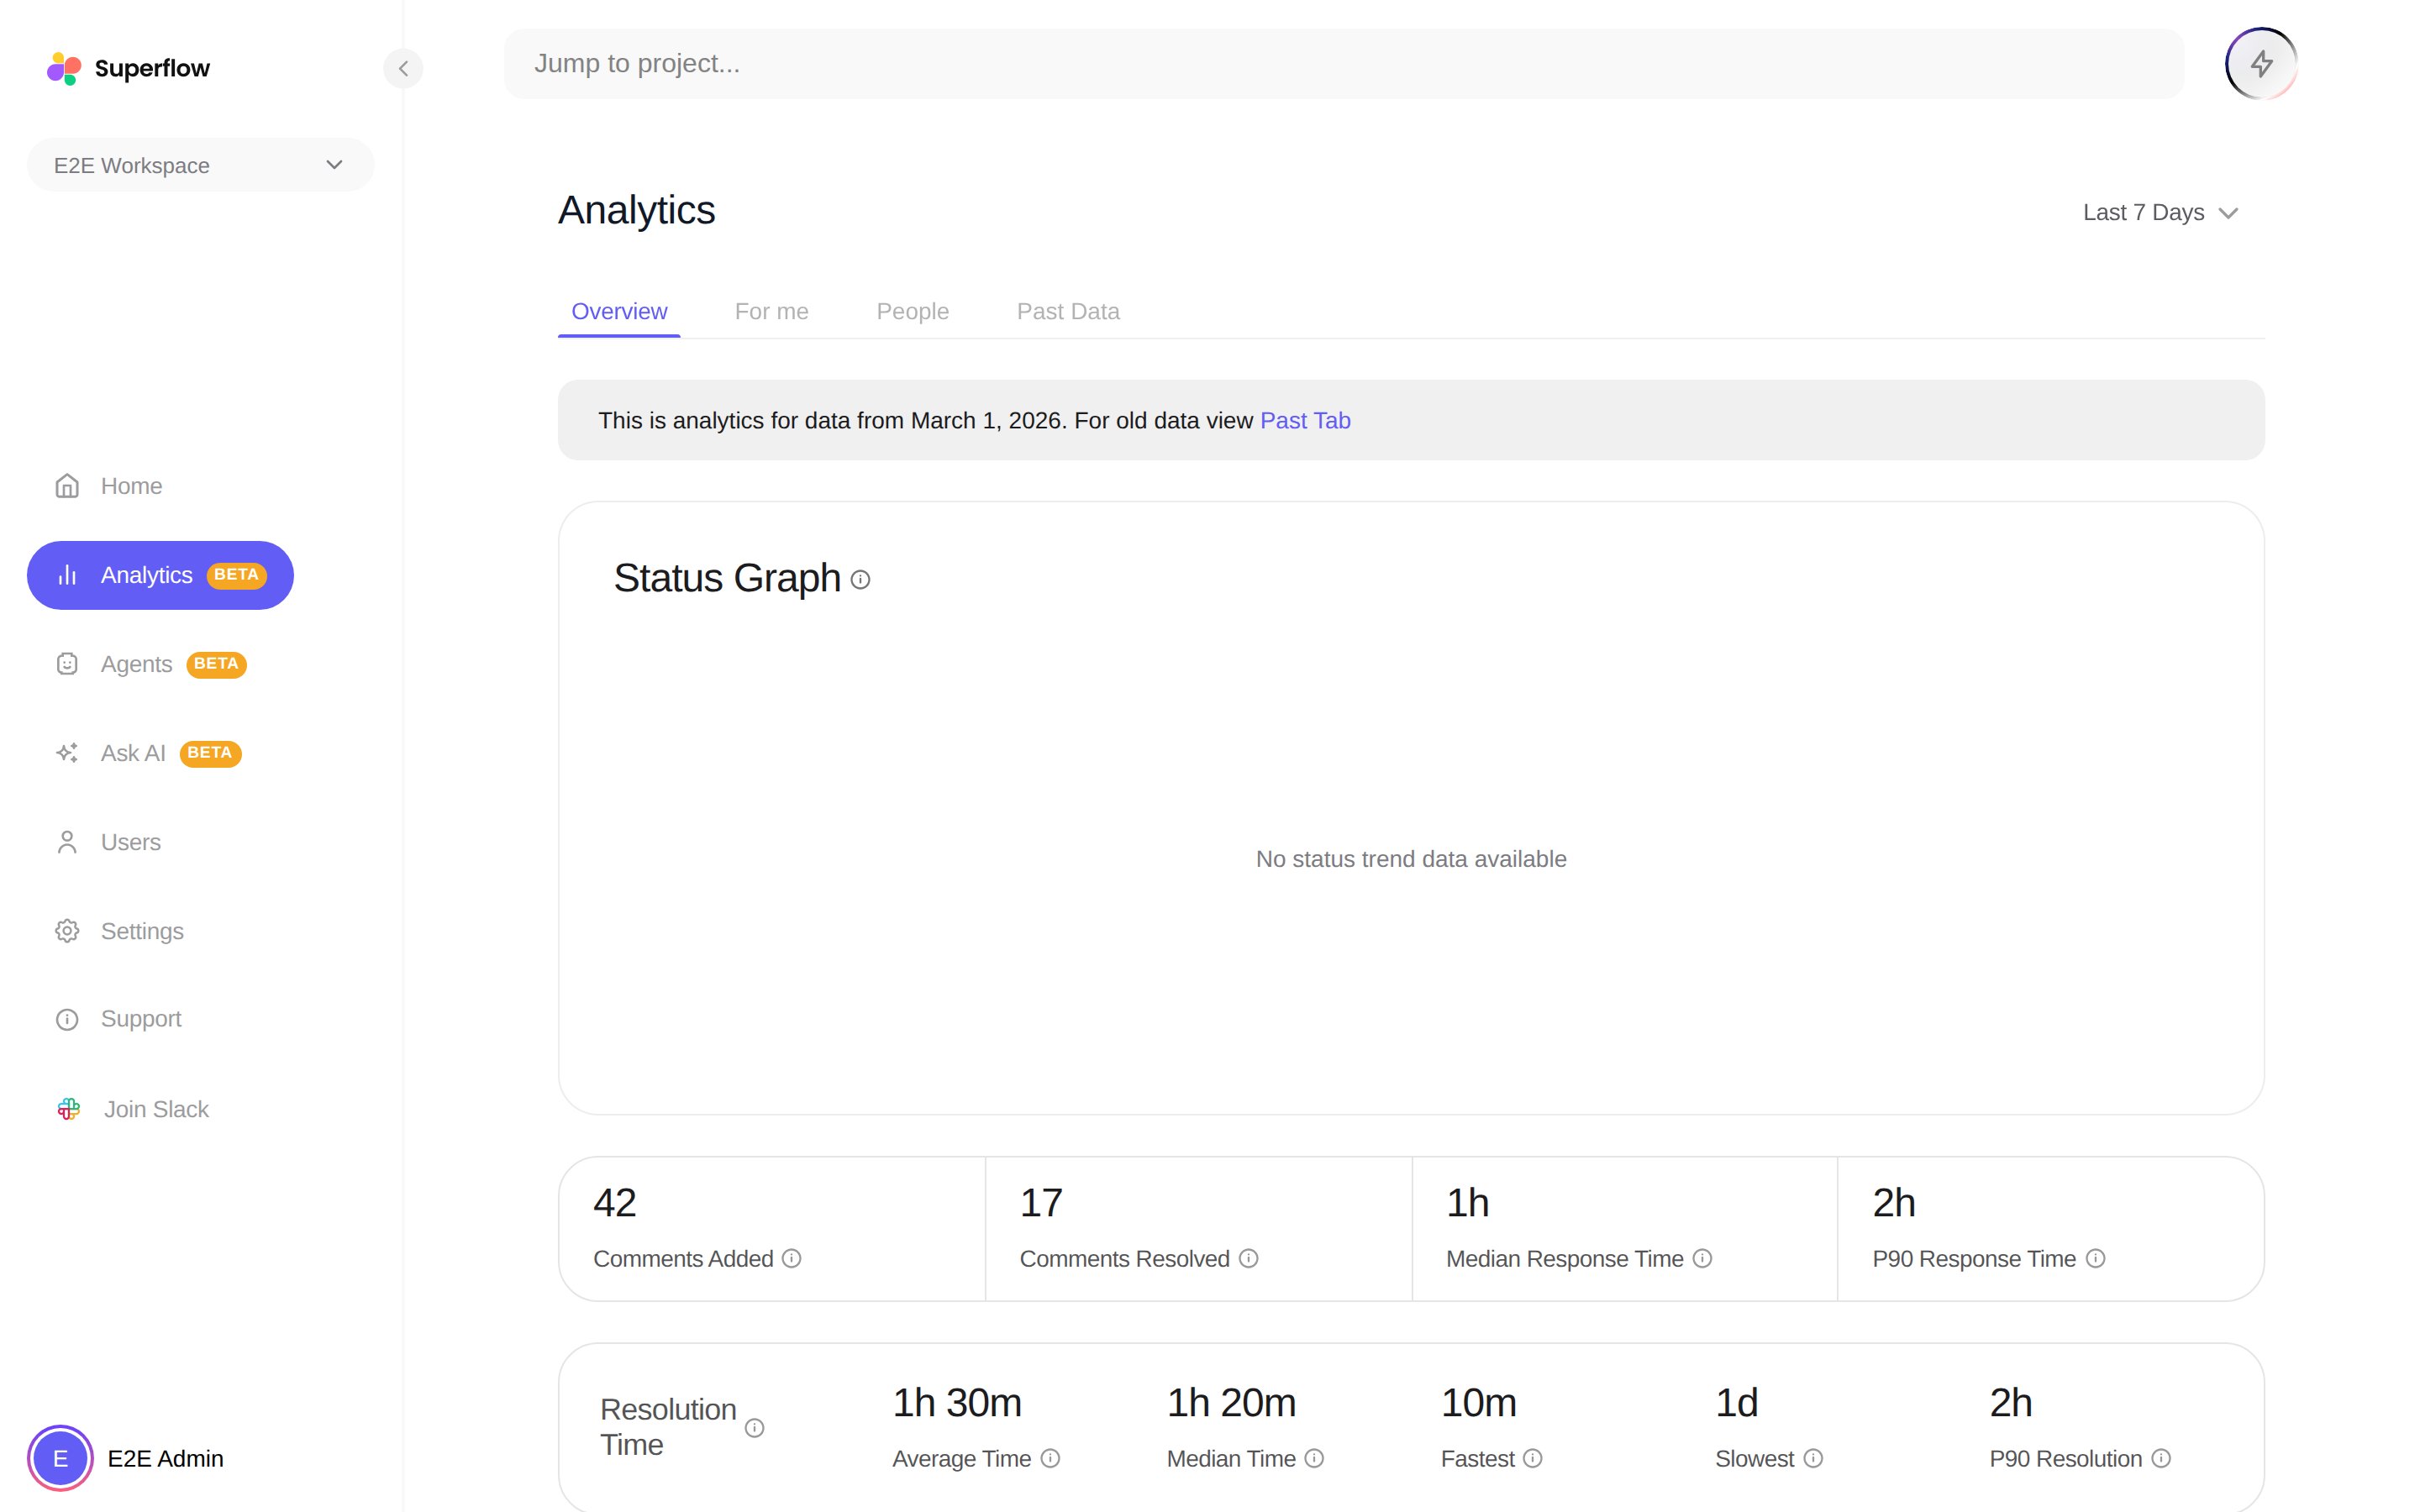
Analytics is currently in Beta. Use the lookback period dropdown in the header to change the date range for every tab except Past Data.
The four tabs
1
Overview shows the whole team
A status trend chart over time, plus two stat cards: Comment Stats (comments added, comments resolved, median response time) and Resolution Time (average, median, fastest and slowest). Top Projects by Tasks ranks projects by open comments, with a link straight to each project’s board.
2
For me shows your own queue
Top Projects by Pending Tasks ranks the projects where you have open work, and Awaiting your response lists the comments waiting on you specifically.
3
People shows who is waiting on whom
Pending Tasks per person shows where feedback is piling up, and Fastest Resolution Time shows who resolves feedback quickest.
4
Past Data holds your history
Data from before March 2026 lives on its own tab with comments and replies, median response time, top active projects, and active users for that period.